This search combines search strings from the content search (i.e. "Full Text", "Author", "Title", "Abstract", or "Keywords") with "Article Type" and "Publication Date Range" using the AND operator.
Beilstein J. Nanotechnol. 2022, 13, 1268–1283, doi:10.3762/bjnano.13.105
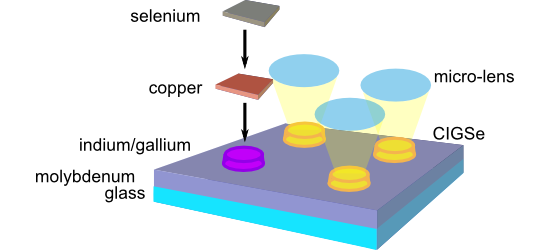
Figure 1: Images of four distantly related and differently sized cribellate spiders with same-sized nanorippl...
Figure 2: Principle geometry of the interaction of a nanofiber with a periodic sinusoidal surface topography ...
Figure 3: The three possible states: A (a, b), B (c, d), and C (e, f). (a, c, e) show the total energies Etot...
Figure 4: Transition from adhesive to anti-adhesive state for varying fiber radii ranging between 10 and 200 ...
Figure 5: Relative total energy for different characteristic lengths λ for a fiber radius of R = 15 nm (the o...
Figure 6: Scanning electron micrograph of electrospun nanofibers. One can see the random orientation of the i...
Figure 7: Peel-off force measurement of polished (a) and LIPSS-covered (b) steel samples. The applied weights...
Figure 8: Peel-off force per unit length measurement results from Table 1 and Table 2 (mean values) visualized as bar plot....
Figure 9: LIPSS-covered and polished titanium alloy surfaces after peel-off of an electrospun nonwoven. While...
Figure 10: (a) Photography of a laser-structured titanium alloy sample after ultrafast laser processing. The c...
Figure 11: (a) Photography of the setup for the electrospinning process. (b) Top view of the spun sample after...
Figure 12: Measurement principle of the newly established peel-off test avoiding edge effects. Blue: sample wi...
Figure 13: Setup used for the peel-off force measurements.
Beilstein J. Nanotechnol. 2018, 9, 3025–3038, doi:10.3762/bjnano.9.281
Figure 1: Design of a planar CIGSe solar cell.
Figure 2: Scheme of the micro-concentrator solar cell concept.
Figure 3: Schematic representation of ordered indium island growth on fs-laser structured, molybdenum-coated ...
Figure 4: Optical micrographs of fs-laser-treated glass. For each line, the number of pulses per spot, N, is ...
Figure 5: Scanning electron micrographs of laser-induced modifications on glass. Laser parameters: F = 1.63 J...
Figure 6: Scanning electron micrographs of individual laser-generated ablation spots on glass (top row) and c...
Figure 7: Optical micrographs of a laser-generated spot array on glass (left) and a corresponding array after...
Figure 8: Scheme of laser-induced forward transfer. The scale bars in the OM insets on the right-hand side co...
Figure 9: Optical micrographs of LIFT deposits on molybdenum on glass. Cu–In donor layer: 20 nm copper, 200 n...
Figure 10: Scheme of the bottom-up process for the preparation of CISe or CIGSe microabsorbers via the nucleat...
Figure 11: Processing of In precursor islands prepared by the nucleation approach (left) to CISe micro absorbe...
Figure 12: Scheme of the process for manufacturing solar cells from microabsorbers. a) CISe absorber, b) spin ...
Figure 13: Cross section of a CISe micro absorber island after processing to a micro cell imaged by tilted-vie...
Figure 14: Electrical characterization with different light concentration factors for a CISe microcell from th...
Figure 15: Electrical characterization under various light concentration factors for CIGSe micro cell from nuc...
Figure 16: Electrical characterization under various light concentration factors for CIGSe micro cell from LIF...